
The Infrastructure Capital Equity Income ETF
- InfraCap Management

- Feb 1
- 9 min read
Fund Overview |
The Fund seeks to maximize income and pursue total return opportunities.
KEY FEATURES | INVESTMENT PROCESS |
DIVERSIFIED INCOME Target a high yield through allocations primarily to large-capitalization equities with attractive dividend characteristics as well as smaller allocations to convertible and preferred securities. ACTIVELY MANAGED Seek outperformance versus passive large cap dividend funds and indices such as the Bloomberg US Large Cap Dividend Yield Total Return Index* through security selection using a mix of quantitative and qualitative analysis. ENHANCED YIELD Seek incremental income while preserving upside exposure by strategically writing short duration covered call options on single companies in the portfolio. Separately, employ modest leverage (typically 20-30%). |
|
*The Bloomberg US High Yield Very Liquid Index (VLI) tracks a more liquid segment of the US dollar-denominated high-yield corporate bond market. The price-to-earnings (P/E) ratio is a valuation metric that compares a company's stock price to its earnings per share (EPS). EV/EBITDA is a valuation multiple that compares a company's total value (Enterprise Value, or EV) to its earnings before interest, taxes, depreciation, and amortization (EBITDA). he p/FFO ratio, or Price to Funds From Operations ratio, is a valuation metric for Real Estate Investment Trusts (REITs) that compares the stock's market price to its Funds From Operations (FFO) per share. | |
Enhanced Risk Adjusted Returns | |||
Asset Class | Anualized Return | Anualized Volatility | Return/Vol |
High Yield Bond | 6.75% | 8.75% | 0.77 |
Municipal Bond | 3.57% | 4.67% | 0.76 |
S&P 500 | 10.71% | 14.56% | 0.74 |
Leveraged Loans | 4.94% | 6.74% | 0.73 |
Investment Grade Bond | 4.20% | 6.31% | 0.67 |
US Treasuries | 2.80% | 4.51% | 0.62 |
S&P 500 Equal Weighted | 9.78% | 16.61% | 0.59 |
Since 2003, high-yield bonds have delivered superior risk-adjusted returns, outperforming both fixed-income and equity peers in return per unit of volatility
Past performance does not guarantee future results. Investors cannot directly invest in an index
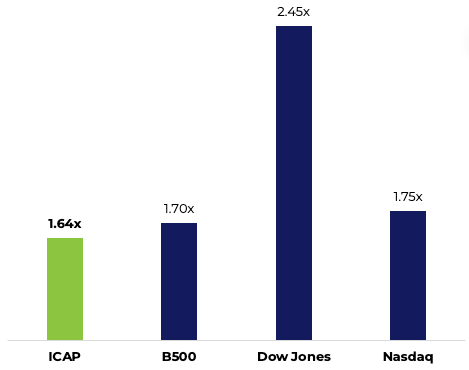
High Yield & Monthly Income |
Equity Yields 12/31/2025

By deploying active strategies, ICAP seeks to deliver higher yield than traditional equity indices while offering appreciation potential.
ICAP: Infrastructure Capital Equity Income ETF; S&P 500: The S&P 500 is a stock market index that represents the performance of 500 of the largest publicly traded companies in the U.S. It's a widely used benchmark for the overall U.S. stock market and economy, weighted by market capitalization, meaning larger companies have a greater influence on its value. The Dow Jones, or Dow Jones Industrial Average (DJIA), is a stock market index that tracks the performance of 30 large, publicly traded companies on the New York Stock Exchange (NYSE) and Nasdaq. The Russell 2000 Index is a small-cap U.S. stock market index that makes up the smallest 2,000 stocks in the Russell Index. The Nasdaq Composite is a stock market index that includes almost all stocks listed on the Nasdaq stock exchange. The indices are unmanaged, its returns do not reflect any fees, expenses or sales changes, and is not available for direct investment.
Historical Large Cap Dividend Returns |
Growth of $10,000
12/31/1999 - 12/31/2025

Historically, large-cap dividend stocks have outperformed — $10,000 invested in Dividend Aristocrats since 12/31/1999 grew to $118,775, versus the S&P 500’s $75,297
Data obtained from Bloomberg. The S&P 500 Dividend Aristocrats is a stock market index composed of the companies in the S&P 500 index that have increased their dividends in each of the past 25 consecutive years. The S&P 500 is a stock market index that represents the perforance of 500 of the largest publicly traded companies in the U.S. It's a widely used benchmark for the overall U.S. stock market and economy, weighted by market capitalization, meaning larger companies have a greater influence on its value.
Valuation Framework - GARP | |
 |  |
A lower PEGY ratio signals a more attractive valuation relative to earnings growth and income potential. ICAP's PEGY outshines peers, underscoring its value.
The PEGY ratio is a financial metric that combines a company's Price-to-Earnings (P/E) ratio with its projected earnings growth rate and dividend yield to help identify undervalued stocks.
Attractive Valuation |
Earnings Multiples: S&P500 vs Dividend Aristocrats
12/31/2025
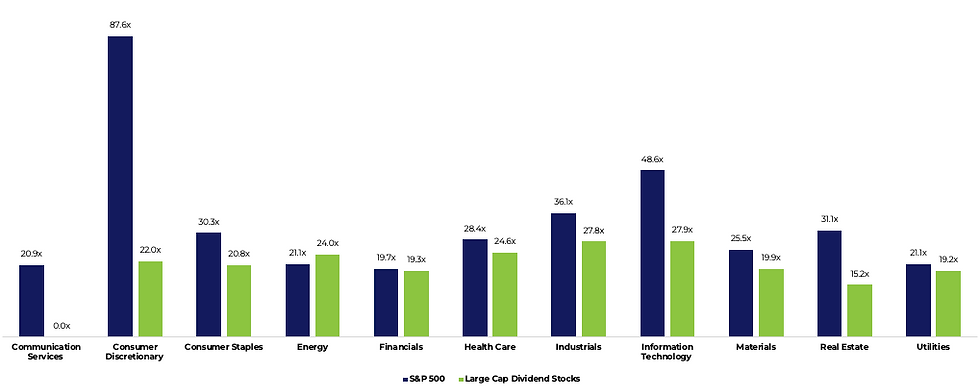
Dividend Aristocrats trade at lower earnings multiples than peers within the S&P 500, underscoring the relative value potential of large cap dividend stocks.
Investment Rationale | |
 | |
Covered Call Strategy to Enhance Income | |
ICAP Active Management Option Strategy Selective use of covered calls.
Focus on securities believed to have less upside potential relative to market perception. Align strike prices with internal price targets that trigger a sell signal to minimize “forgone value”. Optimize income by increasing use of covered calls during periods of elevated volatility metrics. Optimize income by managing the ratio of options to underlying shares during period between initially writing the option and expiration date. |  |
The Infrastructure Capital Equity Income ETF | |
Fund Details | Performance (12/31/2025) |
|   |
Performance data quoted represents past results. Past performance is no guarantee of future results and current performance may be higher or lower than the performance shown. Investment return and principal value will fluctuate, so your shares, when redeemed, may be worth more or less than their original cost. NAV returns are calculated using the Fund’s daily 4:00 p.m. NAV and include the reinvestment of all dividends and other distributions (reinvested at the Fund's NAV on distribution ex-date). Market price returns are calculated using the 4:00 pm midpoint between the bid and offer and include the reinvestment of all dividends and other distributions (reinvested at the 4:00pm bid/offer midpoint on distribution ex-date). Market price returns do not represent the return you would receive if you traded at other times. Benchmark: The Bloomberg US Large Cap Dividend Yield Total Return Index. The index is unmanaged, its returns do not reflect any fees, expenses or sales changes, and is not available for direct investment. Fees & Expenses: The Gross Expense Ratio for the Fund is 3.19%. The Expense Ratio represents the fund’s Total Annual Fund Operating Expenses, which includes a management fee, structured as a unified fee, out of which the Fund’s subadviser pays all routine expenses, except for certain payments as described in the prospectus, which are paid by the Fund. Investors should consider the investment objectives, risks, charges, and expenses carefully before investing. For a prospectus with this and other information about the Fund, please click here. Please read the prospectus carefully before investing. For more information about the Fund, Fund strategies or InfraCap, please reach out to Craig Starr at 212-763-8336 (Craig.Starr@icmllc.com). A word about risk: Investing involves risk, including possible loss of principal. An investment in the Fund may be subject to risks which include, among others, investing in equities securities, dividend paying securities, utilities, small-, mid- and large-capitalization companies, real estate investment trusts, master limited partnerships, foreign investments and emerging, debt securities, depositary receipts, market events, operational, high portfolio turnover, trading issues, active management, fund shares trading, premium/discount risk and liquidity of fund shares, which may make these investments volatile in price. Foreign investments are subject to risks, which include changes in economic and political conditions, foreign currency fluctuations, changes in foreign regulations, and changes in currency exchange rates which may negatively impact the Fund's returns. Small and Medium-capitalization companies, foreign investments and high yielding equity and debt securities may be subject to elevated risks. The Fund is a recently organized investment company with no operating history. Please see prospectus for discussion of risks. Diversification cannot assure a profit or protect against loss in a down market. | |
The Infrastructure Capital Bond Income ETF | |
Top Holdings | Sector Allocation 12/31/2025 |
|  |
Returns for periods of less than one year are cumulative total returns. The fund commenced operations on December 29th, 2021, therefore the performance in the period above reflects only a partial time period. Performance data quoted represents past performance. Past performance does not guarantee future results. Investment return and principal value will fluctuate so that shares, when redeemed, may be worth more or less than their original cost. Current performance may be lower or higher than the performance data quoted. Please call 800-617-0004 for performance data current to the most recent month end. Shares are bought and sold at market price (not NAV) and are not individually redeemed from the Fund. Total Returns are calculated using the daily 4:00pm EST net asset value (NAV). Market price returns reflect the midpoint of the bid/ask spread as of the close of trading on the exchange where Fund shares are listed. Market price returns do not represent the returns you would receive if you traded shares at other times. | |
Disclosures |
CONFIDENTIAL: This presentation is intended only for the designated recipient or recipients that voluntarily visit the Infrastructure Capital web site or have obtained this by means of communications with the firm. It may contain confidential or proprietary information and may be subject to attorney-client privilege or other confidentiality protections. If you are not among the designated recipients, you are not permitted to review, copy, or distribute this message. DISCLOSURE: The information contained herein represents our subjective belief and opinions and should not be construed as investment advice. The information and opinions provided should not be taken as specific advice on the merits of any investment decision. Investors should make their own decisions regarding any investments mentioned, and their prospects based on such investors’ own review of publicly available information and should not rely on the information contained herein. Infrastructure Capital Advisors, LLC nor any of its affiliates accepts any liability whatsoever for any direct or consequential loss howsoever arising, directly or indirectly, from any use of the information contained herein. This data includes information based on data and calculations sourced from Bloomberg and third-party sources. We believe that the data is reliable, we have not sought, nor have we received, permission from any third-party to include their information in this article. Comparative fund information is provided for informational purposes only, funds may have different characteristics and risks which are not presented. Many of the statements in this file reflect our subjective belief. This information is not an offer to sell, or solicitation of an offer to buy any investment product, security, or services offered by Jay Hatfield, or Infrastructure Capital Advisors, LLC, (“ICA”) or its affiliates. ICA, will only conduct such solicitation of an offer to buy any investment product or service offered by ICA, if at all, by (1) purported definitive documentation (which will include disclosures relating to investment objective, policies, risk factors, fees, tax implications and relevant qualifications), (2) to qualified participants, if applicable, and (3) only in those jurisdictions where permitted by law. Jay Hatfield or ICA has beneficial long position in securities discussed either through stock ownership, options, or other derivatives; nonetheless, under no circumstances does any article or interview represent a recommendation to buy or sell these securities. This discussion is intended to provide insight into REIT preferred stocks and is not a solicitation of any kind. ICA buys and sells securities on behalf of its fund investors and may do so, before and after any particular article herein is published, with respect to the securities discussed in any article posted. ICA's appraisal of a company (price target) is only one factor that affects its decision whether to buy or sell shares in that company. Other factors might include, but are not limited to, the presence of mandatory limits on individual positions, decisions regarding portfolio exposures, and general market conditions and liquidity needs. As such, there may not always be consistency between the views expressed here and ICA's trading or holdings on behalf of its fund investors. There may be conflicts between the content posted or discussed and the interests of ICA. Please reach out to the ICA for more information. Investors should make their own decisions regarding any investments mentioned, and their prospects based on such investors’ own review of publicly available information and should not rely on the information contained herein. ICA nor any of its affiliates accepts any liability whatsoever for any direct or consequential loss howsoever arising, directly or indirectly, from any use of the information contained herein. We have not sought, nor have we received, permission from any third-party to include their information in this article. Certain information contained in this document constitutes “forward-looking statements,” which can be identified by the use of forward-looking terminology such as “may,” “will,” “should,” “expect,” “anticipate,” “project,” “estimate,” “intend,” “continue” or “believe” or the negatives thereof or other variations thereon or other comparable terminology. Due to various risks and uncertainties, actual events or results may differ materially from those reflected or contemplated in such forward-looking statements. The information contained herein represents our subjective belief and opinions and should not be construed as investment, tax, legal, or financial advice. If you have any questions, please reach out to Craig Starr at Craig.Starr@icmllc.com or 212-763-8336. Investors should consider the investment objectives, risks, charges, and expenses carefully before investing. For a prospectus with this and other information about the Fund, please visit https://www.infracapfund.com/icap. Please read the prospectus carefully before investing. For more information about the Fund, Fund strategies or InfraCap, please reach out to Craig Starr at 212-763-8336 (Craig.Starr@icmllc.com). |
Comments