
ADJUSTED CPI REPORT
December 2025 Release:
Infrastructure Capital Real-Time Consumer Price Index Analysis
CPI-U vs CPI-R Adjusted
New York - Updated January 26, 2026 ~ The team at Infrastructure Capital Advisors has updated the Real Time Consumer Price Index (CPI-R). To provide an inflation indicator that is more current and reflective of market conditions, we have replaced the Case-Shiller Home Price Index with a seasonally adjusted average of Apartment List's "National Rent Report” and Zillow's "Home Value Index". We believe this average provides a more current estimate for shelter inflation and can be substituted as the shelter component in the Consumer Price Index (CPI). The BLS methodology is only updated every 6 months and relies on homeowners estimating rents on their own homes. Based on our review, the BLS methodology can result in a 12-18 month lag in the series.

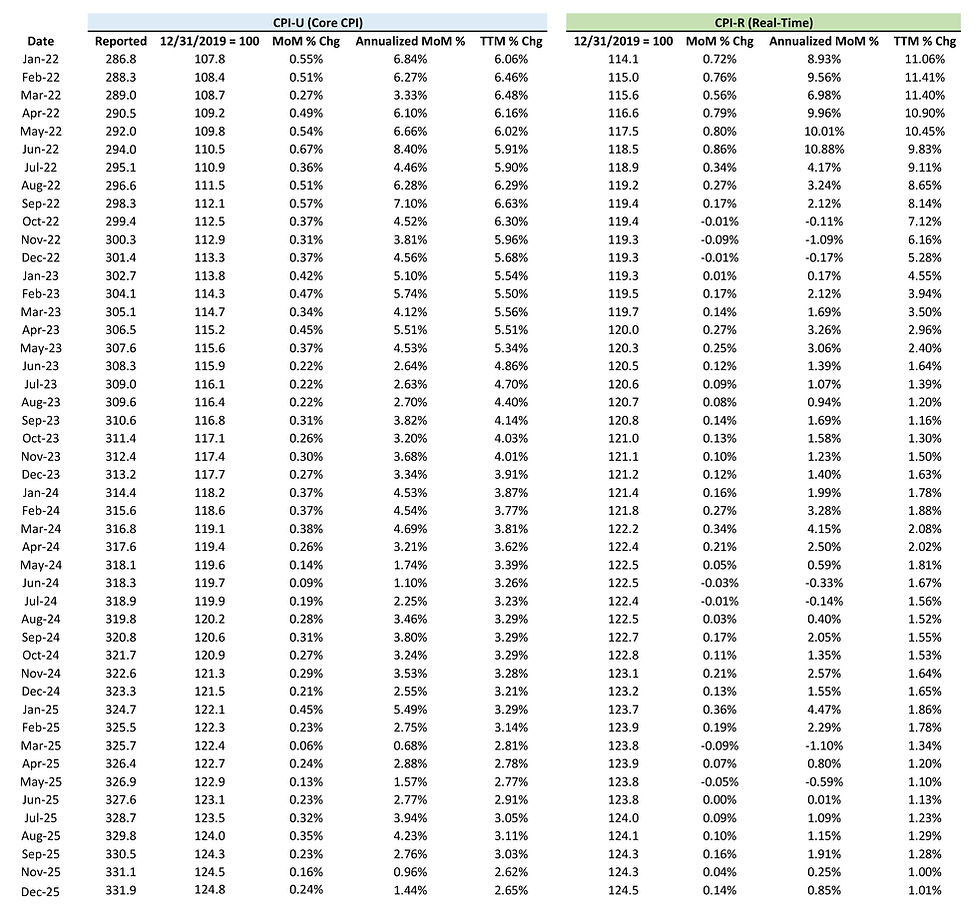
CPI Analysis Summary for CPI-U vs CPI-R: Core CPI totaled +0.24% in December and +2.65% YoY, which was inline with consensus expectations. CPI-R was +0.14% in December and +1.01% YoY. In the CPI-R December data, our shelter index shows national rents and housing were +0.08% in December and -0.59% YoY. This compares to CPI reported shelter inflation of +0.30% in December and +3.25% YoY.
How Our Adjusted CPI-R analysis can help the Investing Community: We believe financial firms, advisors, and individual investors can use our adjusted CPI-R to better recognize real-time changes in the economy and use the CPI-R indicator when constructing investing strategies. We believe the index helps investors recognize current housing and rental costs to determine how inflation may impact their portfolio.
The Adjusted CPI (CPI-R) Index:
See below for the Core CPI vs ICA Adjusted CPI data with the monthly update. Click on the table image to enlarge it for better reading or click SEE FULL REPORT PDF to go to the PDF reader to read, save, or print this data file.
CORE CPI vs ICA ADJUSTED CPI DATA
Updated with December 2025 CPI Data - Reported in January 2026
Click HERE to open a PDF with data in easier-to-view and printable format.photoshop
Prelude to the creation of the real-time consumer price index:
The critical disadvantage of the CPI is that in the early 1980s, the methodology was changed from estimating the cost of shelter from housing prices to an arcane and highly lagged measure focused on rent and owner’s equivalent rent. The issue with this change is that it creates a lag between the onset of inflation in shelter costs and the ultimate reflection in the CPI.
Specifically, the BLS uses a survey of homeowners asking them what they think their house would rent for. This methodology has two significant issues: the survey creates a significant lag and homeowners may or may not have any idea what their own homes would rent for, since they are unlikely to rent out their own homes. In fact, CPI shelter is classified as a lagging indicator of economic activity by economists.
We believe that if the Fed had been analyzing real-time indicators of inflation, they would have started tightening policy in 2021 instead of starting at the beginning of 2022. In addition, the Fed should have paused rate increases at the beginning of 2023 when the TTM CPI-R made progress towards the Fed’s 2.0% target. The table above summarizes the Infrastructure Capital Real-Time Consumer Price Index (CPI-R).


